For many departments, understanding what your data is telling you and accessing the information you need, when you need it can be challenging. Let’s face it – crunching data can be complex.
The Solution
Continuum’s near real-time dashboards provide Paso Robles immediate access to insights needed to make informed decisions and keep stakeholders in the know.
Paso Robles Fire and Emergency Services use Continuum® to make data-driven decisions and simplify reporting
You know the saying, “you’re only as good as the data shows,” right?
Well, Paso Robles Fire and Emergency Services (PRFES) took that saying seriously when wanting to better understand department metrics. PRRES reies on data for operational, clinical and performance improvement insights, but before Continuum, this wasn’t always easy.
Continuum eliminates the manual work of getting the right information – I keep telling everyone that it takes the analysis out of data analysis.
Brian Lewis
Battalion Chief, Paso Robles Fire and Emergency Services
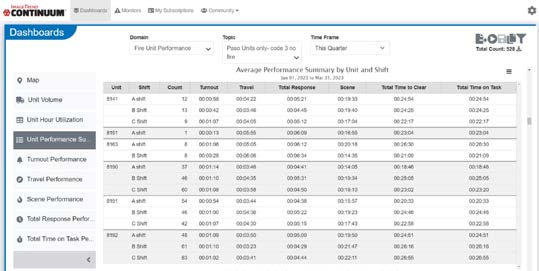
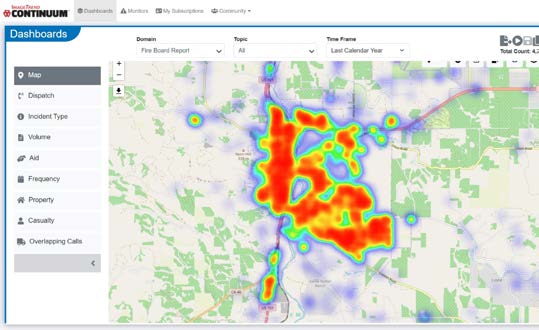
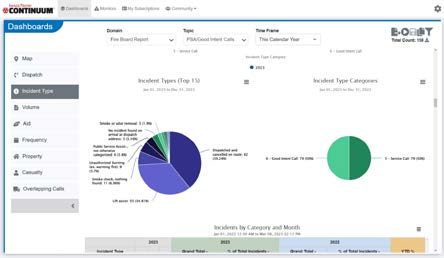
Through a seamless integration, Continuum actively monitors data in PRFES’s Elite system as it is documented or updated to provide easy-to-view insights on topics defined by the department. Continuum Dashboards display maps, charts, and tabular reports allowing PRFES to quickly consume information without crunching data.
So what is the right information? As each department’s goals, objectives and responsibilities vary, so will the answer to this question. For PRFES, a sample of the department’s key topics include:
Wildland fires
Structure fires
EMS calls
Care facilities
Transient calls
Homeless shelters
Vehicle accidents
Total responses
Metrics for each topic will also vary by department. PRFES, for example, has an enroute goal of 60 seconds for non-fire calls, so for calls that EMS respond to, they look at metrics to track and trend turnout times.
Going further, as an A, B, and C shift operation, comparing turnout times between shifts and department averages allows the department to get granular insights with ease.
“Of course, you have the 90th percentiles – that’s what the National Fire Protection Association goes by so that’s really the benchmark for the department,” said Lewis. “But Continuum is so much more than that down to the visual breakdowns of department specifics.”
At the Right Time
What good is the right information at the wrong time?
For departments like PRFES whose leaders regularly meet with their City Council and other stakeholders, Continuum’s Playlists allow content to be grouped together and easily accessed and distributed via URLs.
“Awareness is often the biggest battle, but Continuum makes it easy to send the Fire Chief their report on the 1st of the month,” said Lewis. “The metrics we’ve been able to show stakeholders in the community has caught the attention and impressed other agencies in the county.”
For the Right Reasons
When you have the right information at the right time, you can do powerful things – all for the right reasons, backed by data.
“About three years ago, our department had two apparatus and there would be times when both units were dispatched,” said Lewis. “We’d monitor how long units were unavailable over periods of time and used that data to justify adding a third apparatus. The department continues to monitor metrics on availability down to minutes per day.”
Understanding department demand, equipment usage, unit performance and other insights helps support an effective and efficient department. As part of a recent grant for new department extrication equipment, PRFES has started monitoring traffic collision injuries and the usage of extrication equipment and extrication times to drive improvement in responses.
Lewis said, “Continuum has been an awesome tool to help explain the why behind what we do.”
Having instantaneous data available was instrumental in keeping City Council informed of our inability to meet response time requirements. An in-depth analysis of our total response time data indicated the principal cause of our inability to meet response times was the geographical travel distances between fire stations. The Continuum data was compelling in our justification to add another fire station.
Jonathan Stornetta
PRFES Chief of Fire and Emergency Services
What’s Next?
In 2022, PRFES responded to over 1,000 calls for public service assists – or PSAs as referred to by the department – to help 911 callers with non-emergent needs.
“As a department, we want to know more about these types of calls,” said Lewis. “What is 911 being called for? Why are there so many of these calls? What can we do about it?”
The first step in this process for the department was defining the possible PSA types and their codes for consistent data entry. Next, using Continuum, the department can filter down the types of PSAs they have responded to over periods of time and other adjustable criteria to better understand specific community needs.
“Using this information, we an start looking at ways to proactively facilitate the help those in our community need,” said Lewis. “This is the next big thing for our department and it’s all possible with Continuum.
Crunching data can be complex but with Continuum, you don’t have to crunch it.
Having the right information, at the right time, for the right reasons can turn data into your department’s strongest asset.