Simplify Reporting and Enhance Operational Intelligence
Unlock Data Insights & Intelligence for Better Decision-Making
Gain actionable insights with ImageTrend’s data solutions, designed to help EMS, fire departments, and hospitals unlock the full potential of their data.
From real-time alerts to advanced analytics, simplify data management, improve performance, and support quality improvement initiatives.
Turn raw data into actionable insights with solutions designed to enhance reporting, improve operational performance, and support data-driven decision-making.
Next Gen Report Writer: Simplified Reporting
Spend less time building reports with faster workflows and reusable elements that ensure consistency across your reports. Take advantage of enhanced customization options, over layouts to create reports tailored to your organization’s unique needs.
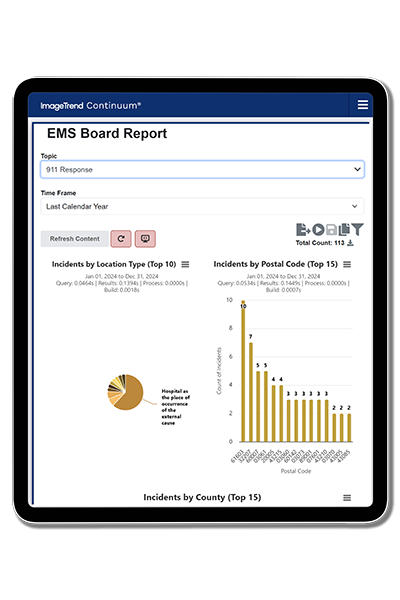
Continuum™: Real-Time Data Monitoring
Receive near real-time updates through configurable alerts sent via email or text. Easily track critical metrics with adaptable dashboards, and uncover trends to support quality improvements using Performance Insights.™
Data Mart™: Advanced Analytics
Perform in-depth data analysis with a star schema database optimized for third-party tools like Tableau and Power BI. Combine data sources, ensure records stay updated, and simplify complex queries with ready-to-use SQL templates.
Continuum Performance Insights makes it easy to evaluate department and crew-level performance.
Comprehensive Data Visualization and Analysis
Unlock the full potential of your data with advanced visualization tools that make trends, patterns, and outliers easy to interpret. Use visual analytics to drive actionable improvements across your organization.
Visual Informatics™: Create dynamic charts, tables, and maps to analyze key performance metrics. Tailor visualizations to highlight clinical, operational, or geographical data for a comprehensive view of your organization’s impact.
Mapping and Reporting System™ (MARS): Visualize geographical trends and patterns with precision. Use mapping tools to pinpoint resource usage, response times, and operational outliers, enabling data-driven improvements in your service area.
Case Study Vandalia Fire Department Boosts Airway Success Rates by 25% with Continuum
Improving operations with real-time data, Vandalia Fire boosted airway success rates by 25% using ImageTrend’s Continuum to streamline reporting and enhance efficiency.
Continuum™: Transform Data into Actionable Insights
Elevate your organization’s performance with Continuum, a real-time data monitoring platform designed to provide clarity, drive improvement, and streamline decision-making processes.
Real-Time Alerts
Stay informed with alerts sent directly to your email or text. Monitor key operational and clinical metrics, such as response times, resource usage, and incident outcomes, to make proactive adjustments.
Configurable Dashboards
Design dashboards tailored to your organization’s priorities. Configure views to visualize trends, compare performance metrics, and share playlists internally or externally via secure URLs to foster collaboration and transparency.
Performance Insights™
Achieve deeper situational awareness by analyzing clinical and operational performance at both the provider and organizational levels. Identify areas for improvement and track progress toward quality initiatives.
Automated Quality Monitoring
Reduce the need for manual oversight with active data monitoring. Continuum’s automation ensures your team focuses on improvements rather than tedious data analysis.
Flexible Integration
Easily integrate Continuum with other ImageTrend modules or third-party tools to extend its functionality. Enhance workflows by pairing real-time insights with historical data for a holistic view.
Ready to Turn Your Data into Actionable Intelligence?
Explore how ImageTrend’s data solutions, including Continuum™, can enhance your decision-making, streamline reporting, and improve operational performance.
“Awareness is often the biggest battle, but Continuum makes it easy to send the Fire Chief their report on the 1st of the month. The metrics we’ve been able to show stakeholders in the community have caught the attention and impressed other agencies in the county.”
Brian Lewis
Battalion Chief, Paso Robles Fire and Emergency Services
Supporting Your Data Intelligence Journey
Navigating complex data processes is easier with the right solutions. Our tools simplify workflows, provide meaningful insights, and empower your team to make informed decisions while improving efficiency and performance.
From user guides and online resources to expert-led training and responsive client services, we’re here to help you get the most from your solutions.